DualSeqDB Tutorial
DualSeqDB is a manually curated database that contains data of gene expression changes in different bacterial infection models, measured by dual RNA-Seq. Please note that DualSeqDB relies heavily on JavaScript, so make sure it is enabled in your browser. To begin, please…
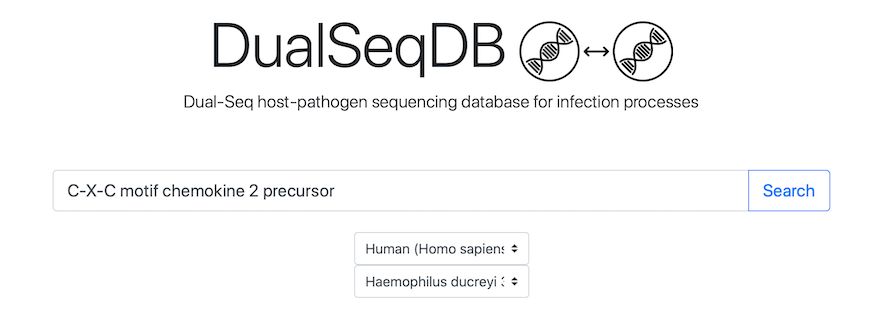
Navigate to the Search tab:
Simply click the screenshot to proceed directly to the Search tab.Searching for a Gene or Protein
To search for a gene or protein, simply type in its name or identifier. Any of the following options are available: gene symbols, gene locus identifiers, NCBI protein identifiers, UniProt protein accessions, or a free-text search in the gene product's description. Then, press the Search button. NCBI protein identifiers are recommended.
Searching for Host and Pathogen
To search within a particular host and/or pathogen, please select the pathogen and/or host name in the drop-down menus and press the Search button. If no gene or protein name is given, this will result in a complete list of genes, similar to the Browse view (described below).
Search results
After searching, the search results page will display a list of any bacterial or host genes matching the search term and species selected:
Simply click the screenshot to proceed directly to the Search results.The column matched by the search term is highlighted in green (if a search term was provided). Partial matches are also supported, so free-text terms can be used (e.g. "chemokine"). For each host and pathogen species and gene, the search results page already shows a preview of the highest log2 fold-change across all tissues and post-infection time points, and the corresponding p-value.
By default, the table is sorted by to show significantly over-expressed proteins at the top (highlighted in red), followed by proteins insignificant expression differences, and finally by significantly under-expressed proteins at the bottom (highlighted in blue). To sort the table as desired, simply click on any of the column headers. The Search Results table can be downloaded as a comma-separated CSV file for export into spreadsheet software such as Microsoft Excel using the "Download Table" button in the top right. An appropriate readable file name is automatically generated. The results can also be linked to and shared with other researchers by right-clicking and copying the "Link to these results" link at the bottom of the page.
To proceed, please click on one of the genes for a detailed view.
Detailed view of infection fitness scores for a gene
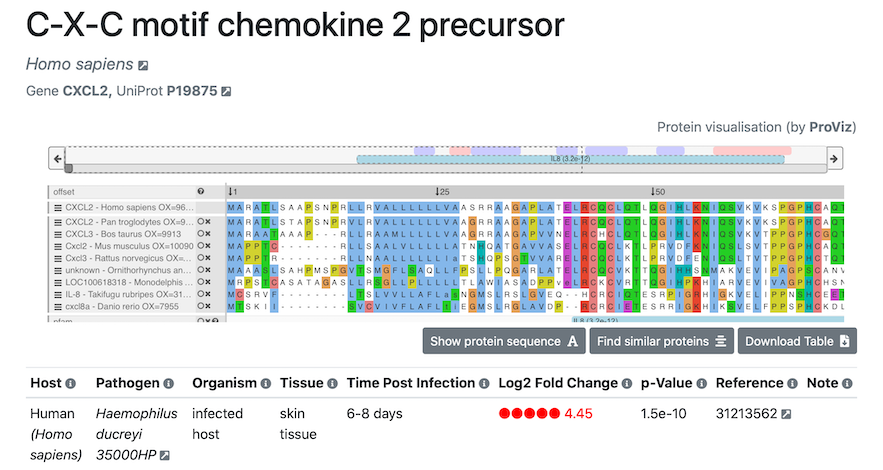
After selecting a gene of interest, a view will open with all the infection information available for the corresponding gene:
Simply click the screenshot to proceed directly to the Display page.The heading of this page provides information on the selected protein: protein and host/pathogen name, length, gene name and UniProt ID.
In the table, all experimental data are listed:
- Tissue of the host organism,
- Tissue condition (whether the experiment was carried out in vivo or in vitro),
- time after infection,
- differential expression gene data, including the log2 fold-change of a gene and the associated p-value (please see the About tab for more information on how these scores are calculated),
- for each bacterial gene, a note giving information on the growth conditions of control bacteria (including temperature and growth phase, if specified in its study),
- reference to the original paper where the data was published.
Alternatively, the protein's FASTA sequence can be displayed by pressing the "Show protein sequence" button, along with a "Copy" link in the top right corner to copy and paste the protein's sequence into other research tools, or into the DualSeqDB BLAST Search to search for similar proteins. You can also immediately search for similar proteins via BLAST (see below for more details) by pressing the "Find similar proteins" button.
To sort the table as desired, please click on any of the column headers. The current table can be downloaded as a comma-separated CSV file for export into spreadsheet software such as Microsoft Excel using the "Download Table" button in the top right. An appropriate readable file name is automatically generated. The results can also be linked to and shared with other researchers by right-clicking and copying the "Link to these results" link at the bottom of the page.
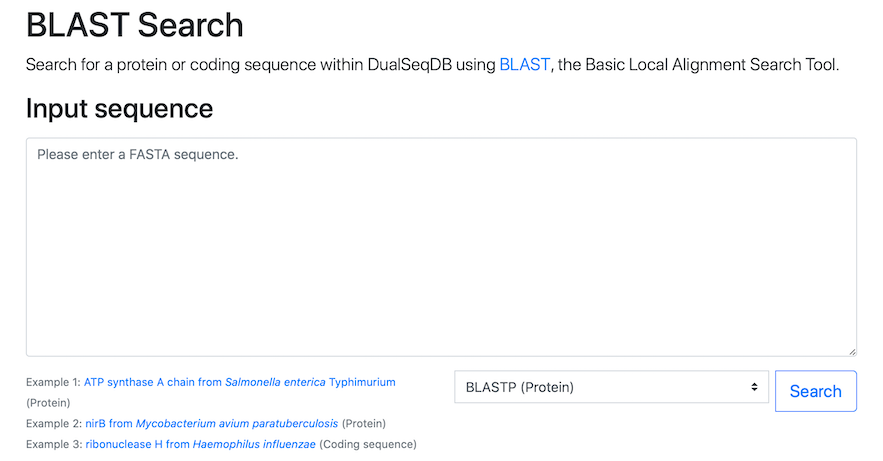
Navigate to the BLAST tab:
Simply click the screenshot to proceed directly to the BLAST search.The BLAST Search tab provides a search by sequence similarity. When the protein of interest is not in our database, the user may search for similar proteins using BLAST sequence alignment. Finding a similar protein with high log2 fold-change in absolute value (and low p-value) is a strong indication that the query sequence may be relevant during infection.
To search for similar proteins in our database using BLAST, please paste in your protein or coding sequence in FASTA format and press the Search button. Both protein and coding sequences can be used, but please ensure that the correct format (protein or coding sequence) is specified in the drop-down menu next to the Search button (as illustrated by the examples provided).
BLAST Search results
When the BLAST alignment is ready, a search results page will open with the following information:
Simply click the screenshot to proceed directly to the BLAST search results.In this view, we display alignment performance together with a complete description of the identified hits:
Identity: The percentage of sequence identity between query and target in the successfully aligned region.
Aligned: The total number of amino acids that were successfully aligned between query and target.
Bit score: The required size of a sequence database in which the current match could be found just by chance. The bit score is a log2-scaled and normalized raw score, meaning that each increase by one doubles the required database size.
E-value: The number of expected hits of similar quality (score) that could be found in the BLAST sequence database just by chance.
The meaning of the Host, Pathogen, Locus, Protein, Gene, Product, p-value, and log2 fold-change columns can be found in the Browse Tab section below, or via the mouse-over information symbols in the top row of any table.
By default, the BLAST matches with the highest Bit scores are shown first, and matches with 100% sequence identity will be highlighted in green. To sort the table as desired, simply click on any of the column headers. As for all tables, the results table can be downloaded as a comma-separated CSV file for export into spreadsheet software such as Microsoft Excel using the "Download Table" button in the top right corner. An appropriate readable file name is automatically generated. The results can also be linked to and shared with other researchers by right-clicking and copying the "Link to these results" link at the bottom of the results table, provided the search sequence is below ~2,000 characters.
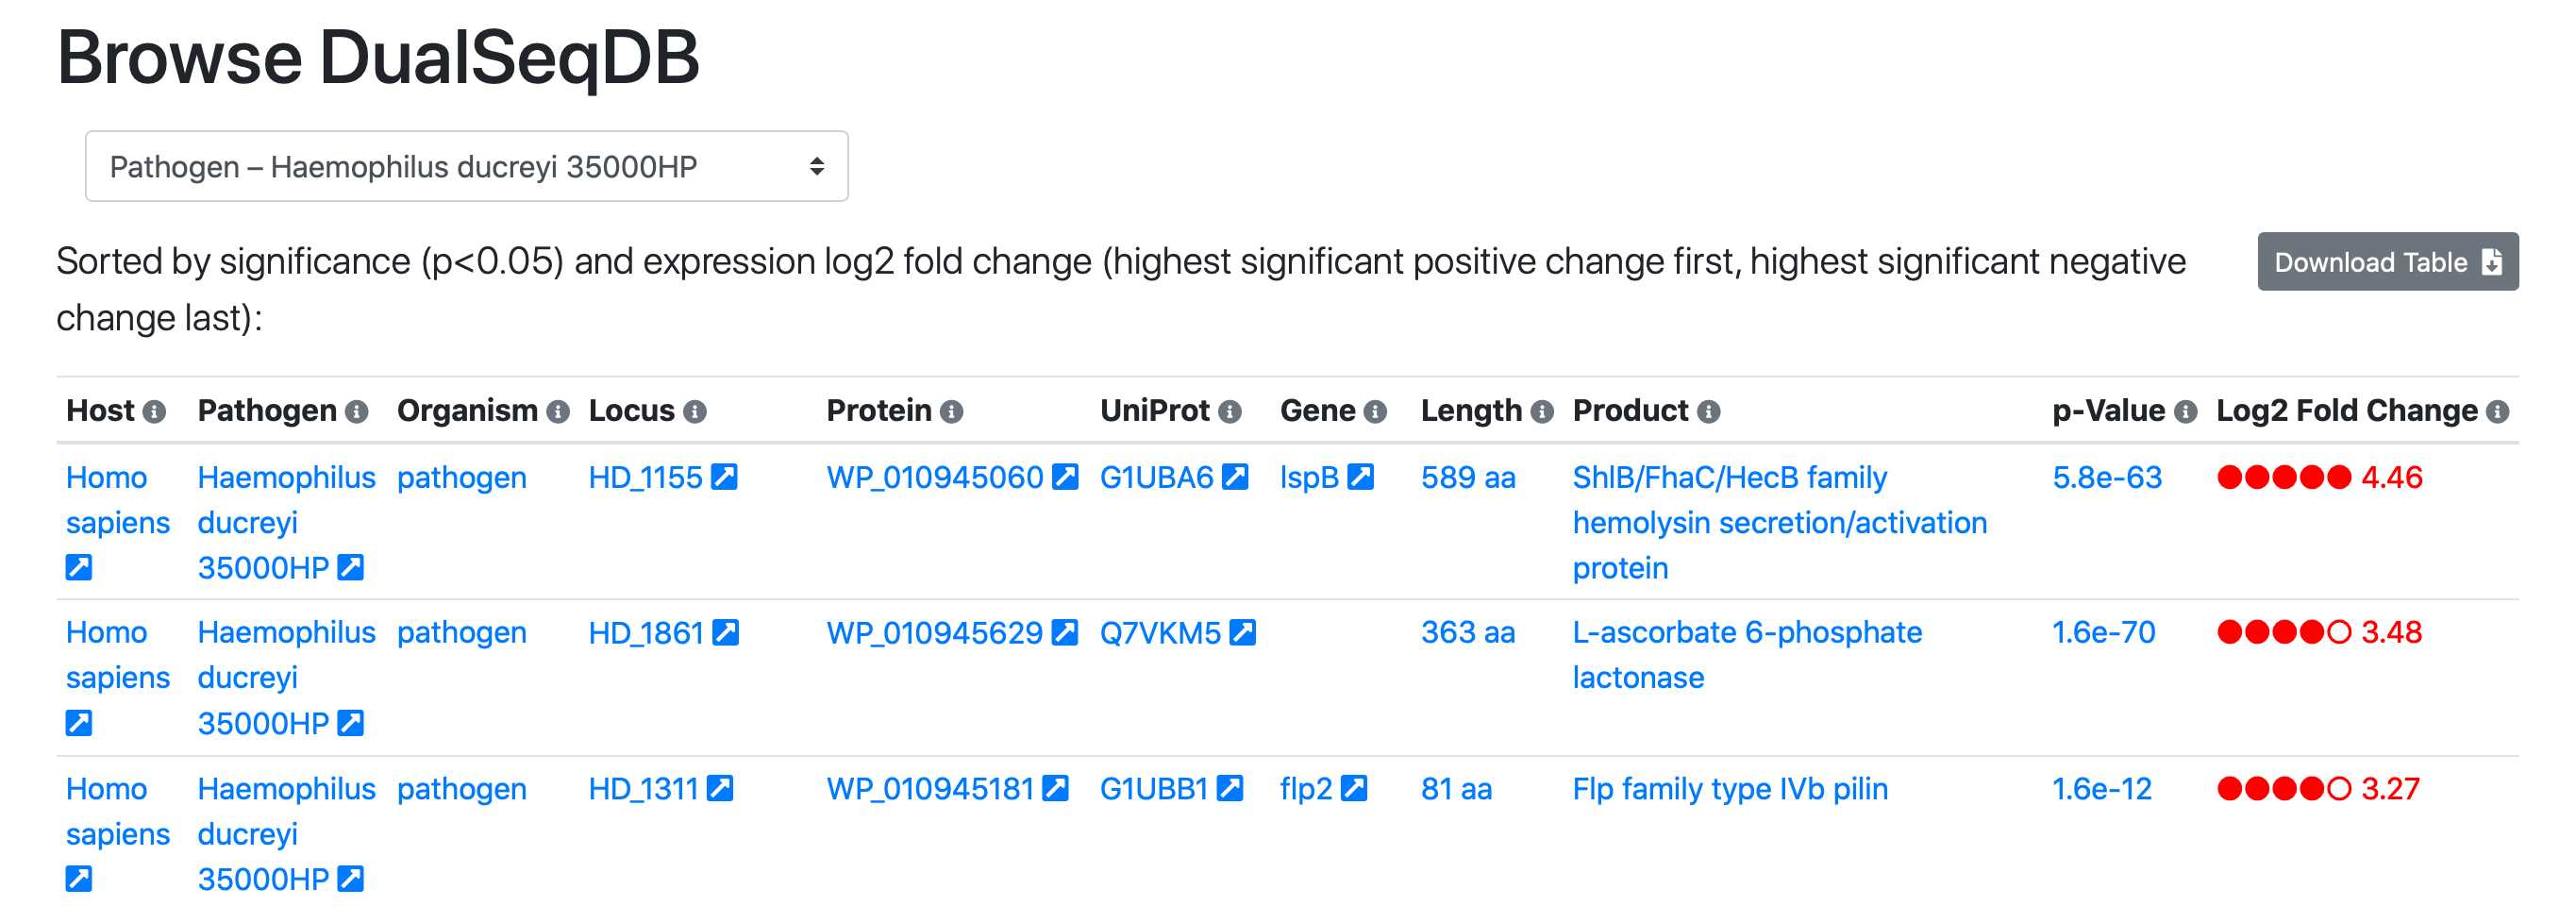
Navigate to the Browse Tab:
Simply click the screenshot to proceed directly to the Browse tab.The Browse Tab
The Browse tab provides an overview of all entries in the DualSeqDB database. A pathogenic species or a host of interest can be chosen in the selection element at the top. This table is sorted by significance and log2 fold-change. It displays pathogen/host genes with significant over-expression during infection at the top, followed by insignificant genes by decreasing log2 fold-change. Genes with significant under-expression are listed at the very end of the table.
Arrows next to each field provide links to useful external databases:
Pathogen/Host: Links out to the NCBI Taxonomy database, a comprehensive taxonomic database.
Locus: Links out to the Ensembl database, which provides genome annotation for all species included in the database.
Protein: Links out to the NCBI Protein database, which provides protein sequences and information.
UniProt Accession and Gene Symbol: Links out to the UniProt Knowledgebase, which provides comprehensive protein annotation.
Click the Locus, Protein, UniProt Accession or Gene Symbol entries to view details for the given protein in the external databases. This information is also available as a mouse-over explanation in the Browse tab.
As for all tables, the table can be downloaded as a comma-separated CSV file for export into spreadsheet software such as Microsoft Excel using the "Download Table" button in the top right. An appropriate readable file name is automatically generated. The results can also be linked to and shared with other researchers by right-clicking and copying the "Link to these results" link at the bottom of the page.
Navigate to the Download tab:
Simply click the screenshot to proceed directly to the Download tab.Downloading the Entire Database
To download the entire DualSeqDB database for local analysis, please click the link available under the Download tab. Currently, DualSeqDB v1 is available, and will be upgraded with new data as they become available.
See also:
The About section for background information, and please feel free to contact us!


